It has been a month since Hurricane Ian made landfall in the state of Florida and as some of the adrenaline starts to wear-off people have begun asking, “What impacts is the storm going to have on water quality going forward? Are we doomed for another red tide event like the one following Hurricane Irma in 2017?” The information presented here reflects the most recent information available on scientific sampling occurring in storm-impacted regions. It is subject to change. For the most recent information, explore the links at the end of article
As of October 28th, 2022…
Who is collecting information on the water after the storm? It is important to note that multiple agencies and organizations participate in regular water quality and fish sampling independent of events like Hurricane Ian. The information they collect provides baseline information for what is considered “normal”. Sampling may be halted or augmented after an event based on what circumstances allow and what information may be most useful. In the southwest Florida region most affected by Hurricane Ian, the list of organizations involved with post-storm sampling and data management includes:
- Calusa Water Keeper
- University of Florida Center for Coastal Solutions
- Charlotte County
- Charlotte Harbor Estuary Volunteer Water Quality Monitoring Network (CHEVWQMN)
- Coastal and Heartland National Estuary Partnership (CHNEP)
- Conservancy of Southwest Florida
- Heal our Harbor
- Florida Department of Environmental Protection (FDEP)/ Charlotte Harbor Aquatic Preserve (CHAP)
- Florida Gulf Coast University (FGCU)
- Florida Sea Grant
- Florida Wildlife Research Institute (FWRI)
- Lee County Natural Resources Department
- Sanibel Captiva Conservation Foundation (SCCF)
- Sarasota Bay Estuary Program
- South Florida Water Management District
- Southwest Florida Water Management District (SWFWMD)
What information is being collected?
Nutrient Concentrations
Plants in freshwater environments are often limited by their access to phosphate whereas plants in saltwater environments are often limited by their access to nitrate. Given the amount of freshwater currently flushing into Charlotte Harbor estuary, phosphate and nitrate tests are being conducted regularly at sampling sites. There is often a delay between sample collection and the lab tests necessary to measure nutrient levels. Data is still under review.
Dissolved Oxygen (DO) and Biological Oxygen Demand (BOD)
DO and BOD are inversely related. Dissolved oxygen measures the concentration of available oxygen in the water, while biological oxygen demand is a measure of how quickly oxygen will be used up by microscopic organisms involved in decomposition. Some have reported fish kills after the storm. Although algae blooms can create hypoxic–or low-oxygen–zones that can be lethal to fish, these zones can exist independently of a bloom. Data collected thus far suggests that the water in the Peace and Myakka Rivers and the areas of Charlotte Harbor they feed into experienced low oxygen levels immediately following Hurricane Ian. Low oxygen levels in the rivers and upper Charlotte Harbor persist through this week. Biological oxygen demand is predicted to increase in the coming weeks as mangrove leaves that were blown off during the storm and other natural debris use oxygen in the water to break down, which may further deplete oxygen levels. Monitoring teams will continue to monitor DO and BOD to assess where and when levels may recover to pre-storm conditions.
Water Levels and Flow
Several gauges are stationed in the Peace and Myakka Rivers that measure water depth and flow rate. Immediately after the storm, not only were water levels high but moving quickly. Since then, the Myakka River Water levels have dropped back below flood stage. Water bodies in Bartow, high up in the Peace River Basin are still in a minor flood stage. The Peace River itself still has slightly elevated water levels but is approaching normal conditions. Lake Okeechobee has risen two feet since the storm. However, the water level is still below flood levels and no releases have occurred.
Bacteria
Bacteria testing is a procedure that has been added to regular water quality monitoring efforts in response to Hurricane Ian. During the storm, water levels compromised septic tanks and damaged sewer systems, eliciting concern about water contamination. Involved agencies are currently testing for E. Coli and Enterococci, which thrive in freshwater and saltwater respectively. Both species serve as indicators of fecal bacteria levels. Where salinities are intermediate (as they often are in an estuary like Charlotte Harbor) tests for both kinds of bacteria are being conducted. A reported sewage spill triggers bacterial tests near the spill.
Immediately following the storm, bacteria levels were so high in Lemon Bay that they exceeded the maximum values measured in bacteria tests. Bacterial levels were also elevated in portions of Sarasota Bay, the Peace River and Charlotte Harbor. In the weeks following, there has been a significant drop-off, suggesting that bacteria may have been flushed out by freshwater moving out to the Gulf of Mexico. On October 24th, bacteria levels were low enough at Charlotte County beaches to earn the highest possible safety rating. Port Charlotte Beach Park and Englewood Beach are currently open, although some amenities may be closed due to storm damage.
Vibrio vulnificus is another beast. Most people know it best as a “flesh eating bacteria”. Vibrio is a bacteria that thrives in warm saltwater environments, which many have had contact with since Hurricane Ian made landfall. Reported cases of Vibrio and associated deaths are elevated in Lee and Collier counties following Hurricane Ian. There has been one case documented in Charlotte County this year, but it has not been connected to the hurricane. For more information on Vibrio vulnificus, visit the Florida Department of Health (FDOH) Website.
Turbidity and color
It is tempting to think of turbidity and water color as the same thing, since they both impact water clarity. But each measurement accounts for a different aspect of water clarity. Turbidity is the amount of solids suspended in the water. Think: adding pepper to a glass of water. Once the water stops moving those solids settle to the bottom, covering the seafloor and potentially filling in depressions if there is enough. Water color (often associated with tannins) is more like steeping a tea bag. Understanding both helps us measure light availability on the seafloor, which is crucial in monitoring the health of light-dependent organisms like seagrasses.
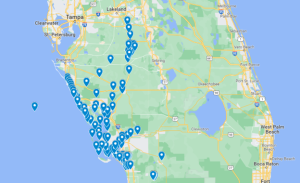
Where are samples being collected? According to preliminary data from the National Weather Service, Hurricane Ian dropped an average of 8.79 inches of rain in Charlotte County, with some counties in the Peace and Myakka River basins receiving upwards of 16 inches. It is important therefore, not just to examine what is happening in our own backyard, but also what may enter the harbor from the rest of our large watershed. The below image shows locations where testing has been conducted since Hurricane Ian. It does not contain information on the consistency of sampling efforts.
Is there going to be another red tide? Earlier this week, high concentrations of Karenia brevis cells (>1,000,000 cells/L) were detected 4-6 miles off beaches in west Charlotte County. The most recent samples detected low concentrations (>10,000-100,000) of K. brevis 3.8 miles off Gasparilla Island. Much like storm prediction models, there are tools available for predicting red tide and associated respiratory conditions. On October 27th, the National Center for Coastal Ocean Science (NCCOS) red tide forecast listed the likelihood of intensification as “somewhat likely”, the second of four likelihood categories. The Mote Marine red tide beach reports have been inconsistent in the area impacted by Hurricane Ian, since it relies on volunteer reports. Respiratory irritation may occur with onshore winds.
A special thanks to Dr. Christine Angelini with the UF Center for Coastal solutions and Brandon Moody with Charlotte County for their input.
Stay up to date with the links referenced in this article
Vibrio
Florida Department of Health: https://www.floridahealth.gov/diseases-and-conditions/vibrio-infections/vibrio-vulnificus/index.html
Bacteria Monitoring
FDOH Healthy Beaches Program:
https://www.floridahealth.gov/environmental-health/beach-water-quality/index.html
Red Tide
Mote Marine Red Tide Beach Forecasts: https://visitbeaches.org/map
National Center for Coastal Ocean Science: https://coastalscience.noaa.gov/research/stressor-impacts-mitigation/hab-forecasts/gulf-of-mexico/
FWC Daily Red Tide Map: https://myfwc.maps.arcgis.com/apps/View/index.html?appid=87162eec3eb846218cec711d16462a72
FWC Fish Kill Reporting System:
https://myfwc.com/research/saltwater/health/fish-kills-hotline
Water Levels and Flows
Unite States Geological Survey National Water Dashboard:
https://dashboard.waterdata.usgs.gov/app/nwd/?region=lower48
Lake Okeechobee and Caloosahatchee Release Levels Tracker:
https://chnep.wateratlas.usf.edu/waterbodies/lakes/1002667/lake-okeechobee/release-levels-tracker
Sampling Organizations
Calusa Waterkeeper: https://calusawaterkeeper.org/
UF Center for Coastal Solutions: https://ccs.eng.ufl.edu/
Coastal and Heartland National Estuary Partnership (CHNEP): https://www.chnep.org/
Florida Sea Grant: https://www.flseagrant.org/
Sanibel Captiva Conservation Foundation: https://www.sccf.org/
Sarasota Bay Estuary Program: https://sarasotabay.org/
Source: UF/IFAS Pest Alert
Note: All images and contents are the property of UF/IFAS.